
“Pessimism always sounds smarter than optimism because optimism sounds like a sales pitch while pessimism sounds like someone trying to help you.”
-- Morgan Housel
There has been no shortage of pessimism on the US market over time; but it hasn’t helped. In fact, we see very clear reasons for optimism.
The valuation offensive
The most common bearish argument we hear is that US stocks are “expensive”, meaning they trade on a higher multiple of earnings relative to non-US stocks. There is clear data to back this up – as of 22 January 2024, the MSCI Europe, Australasia and Far East (EAFE) Index1 for FY23 sits on 14x price-to-earnings (P/E) whereas the MSCI USA Index for FY23 is on 22x.
That eight-point gap is significant, but is it the end of the story? We think not. We know that a P/E ratio in isolation is of limited use – all else equal, lower is better but very little else is equal here.
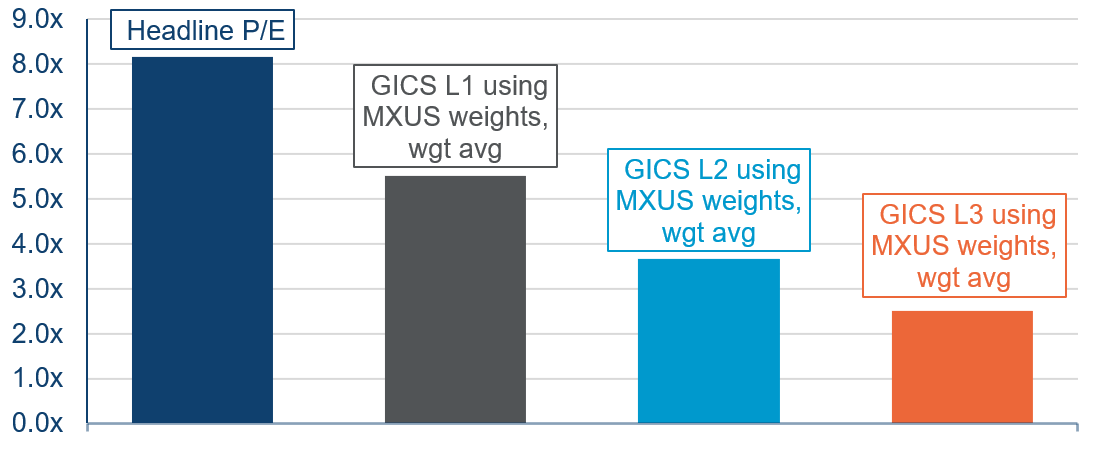
To make the comparison slightly more equal, we could conduct a simple exercise which involves swapping the sector and industry weights of these indices. First, if we apply MSCI USA Index weights to MSCI EAFE P/Es and compare that to the MSCI USA Index, we see the gap closing. It closes even more as the adjustments become more granular. Starting with Global Industry Classification Standard (GICS) Level One, the gap drops by over two multiple points, then by almost four at GICS Level Two and nearly six points, or by 70%, at GICS Level Three2.
The same pattern is observed if we do the analysis in reverse and apply MSCI EAFE weights to MSCI USA Index P/Es. If we gave the MSCI EAFE Index weights to the MSCI USA Index and vice versa, the gap between these would reverse and actually be negative.
The trend suggests that, as you get closer to the company level, the perceived gap becomes narrower. It would not be outlandish to suggest that the 70% closing of the gap could go materially higher if we were to continue the exercise. However, extending to GICS Level Four becomes less meaningful since there is less commonality between the indices3. This demonstrates our wider point – the indices are so different in their composition that any comparison of headline P/Es is not very helpful.
A lot more of the MSCI EAFE Index is made up of banks (8.6% versus 2.9% for the MSCI USA Index), autos (4.8% versus 1.9%), pharmaceuticals (9.7% versus 3.6%) and textiles/apparel (3.8% versus 0.5%), while the MSCI USA Index has more software (10.4% versus 1.8% for the MSCI EAFE Index), interactive media and services and internet (9.4% versus 0.4%) and semiconductors (6.9% versus 2.9%). The former group naturally trades at lower multiples given their growth and risk characteristics, while the latter naturally trades at higher multiples.
This tells us that, comparing like with like to the extent it is possible, a given company in the US is not necessarily and, in reality probably is not, on a higher multiple of earnings than a similar one outside the US.
US companies lead on generating returns
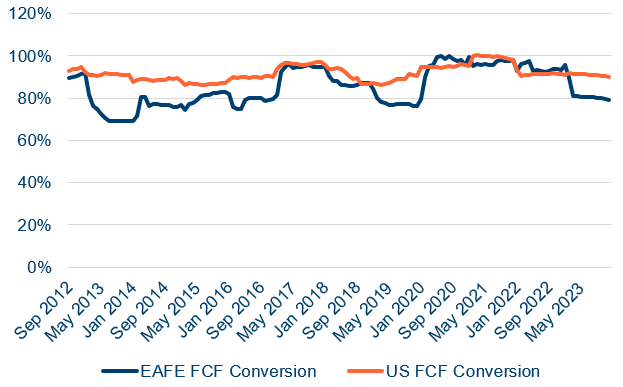
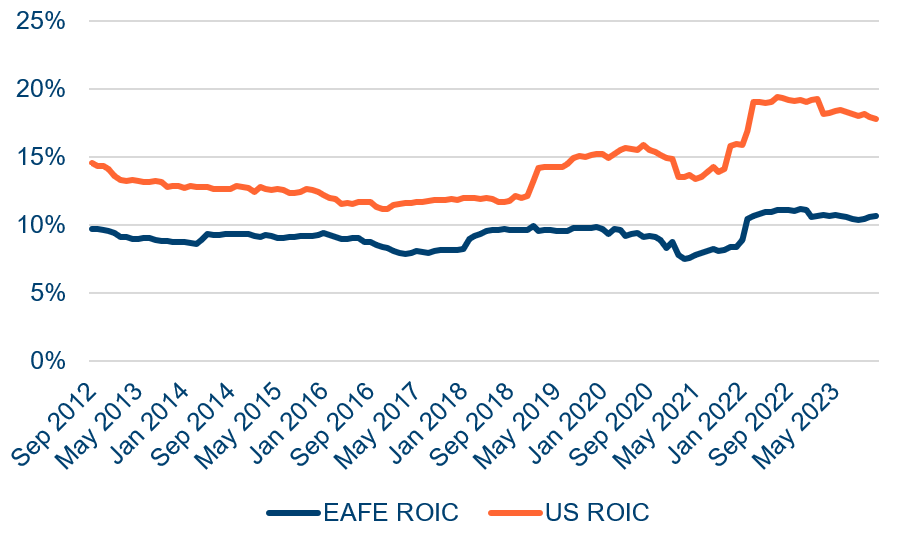
There is more. Not all dollars, euros and krone are born equal. Over the past decade, the average company in the US has converted a dollar of accounting profit into $0.92 of free cashflow (FCF); for the MSCI EAFE Index that is only $0.854. This might seem a modest difference but, when coupled with a significant return on invested capital (ROIC) advantage (an average of 14% compared to 9%), it means that each dollar reinvested generates a higher return and better growth.
US influence spreads far beyond North America
The US accounts for c4% of the global population but c25% of global GDP, with companies listed in the US accounting for c40% of total global market capitalisation – can differences like this really be justified?
What is the biggest search engine in France? The biggest handset company in the UK? The biggest e-commerce site in Germany? The biggest social network in India? The most popular video-streaming service in Korea? In all cases, it is inevitably a US company.
US companies have been taking a huge share of new markets that have been created all over the world, from enterprise software to social media and cloud computing, as well as longstanding markets like retail, media and banking.
Just as a country’s share of global population is not a good guide to its share of GDP, a country’s share of global GDP is not a good guide to its share of global market cap. So much of GDP is unrelated to the listed corporate sector and so much of the listed corporate sector’s activity is outside the US. In fact, c40%5 of the revenues of US-listed companies come from outside the US. Moreover, market cap is a measure of the ability of companies to create value in the future globally, not a measure of value added, domestically, today.
Therefore, it is not a stretch to conclude that US companies, especially the biggest ones, are actually global companies that happen to have come from the US.
A market designed for growth
This is not a coincidence, and leads into another reason why we are optimistic on the US. It is more than just a business-friendly country; it is actively and deliberately structured to allow great minds access to great minds, and capital. The US pulls talent from all over the world; it has a culture, a set of institutions and a sophisticated and deep capital market that all come together to help businesses get off the ground and, once successful, help them grow in a way nowhere else can emulate. Its relatively favourable demographics, including higher fertility rate6, younger population7 and positive net migration should help to prolong these advantages. The US, for the most part, understands capital allocation and the importance of rewarding shareholders for the big risks they take.
Together, these factors help each other and, in turn, compound over time, setting the stage for a continuation of propitious fundamental value progression (operational earnings plus capital return) from US companies over the long term.
The diversification defence
The US, of course, is not homogenous and we believe it is possible to achieve more diversification within the US than by going elsewhere. There is a great deal of index concentration right now compared to the past but that need not be a deterrent. There are plenty more companies than just the ‘Magnificent Seven’. We think an active approach will be better served than passively following the big winners.
The case for the US
Contrary to popular opinion, we do not believe the US market is expensive relative to the rest of the world. In our view, it also offers better prospects for growth as well as global and intra-sector diversification in one, shareholder-friendly market. We believe an active approach to such a market has the ability to reduce index-concentration issues, helping us to create a portfolio of quality businesses, collectively trading at lower multiples of free cashflow than the comparable benchmark. We think a bit of optimism is actually more helpful.
1. MSCI EAFE (MXEA) comprises the top 85% of free float-adjusted mid and large-cap stocks in 21 developed markets excluding the US and Canada; MSCI US (MXUS) comprises the top 85% of free float-adjusted mid- and large-cap stocks in the US.
2. GICS Level Three has 74 industries. Of the 68 in EAFE and 70 in US, 63 are common to both, so the overlap is sufficiently high for this analysis. The overlap is 100% on the 25 GICS Level Two industry groups and 11 GICS Level One sectors.
3. There are 163 sub-industries at GISC Level Four. MSCI EAFE has 128 and MSCI USA has 130. However, only 61 of these are common to both.
4. The latest figures per Style Analytics are $0.79 for EAFE and $0.90 for US. The Polar Capital North America Fund has a 10-year average free conversion of $1.13 and its latest reading as at 10 January 2024 is $1.22.
5. Sources: Morningstar, https://www.morningstar.com/portfolios/youre-more-internationally-diversified-than-you-probably-realize
6. US fertility rate in 2022: 1.73 births per woman (source: World Bank), higher than the average of developed countries at 1.53 (source: UN Population Division).
7. US median age in 2022: 38.8 years (source: World Bank), lower than the average of developed countries at 42.5 years (source: UN Population Division).


